Technology, the internet, and digital tools can facilitate student and audience learning, engagement, and collaboration. Many museums and public history sites encourage the use of technology. Sometimes the site provides it (either screens, tablets, or other electronic devices), and other times they allow participants to use their personal devices like cell phones to participate in digital learning. QR codes, guided audio tours, and interactive digital displays are some methods public history sites employ to engage audiences, but there are a lot more that are easy to incorporate. Maps and data visualizers present information in an interactive way that allows students to learn at their own pace and allows the opportunity for collaboration and discussion amongst peers while social media gives younger participants a familiar tool they can use to present and share information.
Maps show how countries, people, and the natural landscape interact and connect with one another. Many apps and websites, such as StoryMaps, allow various modifications to be added to maps, allowing certain events, routes, and locations to be highlighted or marked. Maps can even be used to play games to teach and learn. Sarah M. Spalding, a professor at Marymount University used maps in a game based on the television show Game of Thrones to actively engage her students in learning history. Spalding says that by using Game of Thrones, her model of active history learning and teaching “allows students to begin thinking about the historical content in a way that is not just information that happened in the past, but as something that is relatable”.
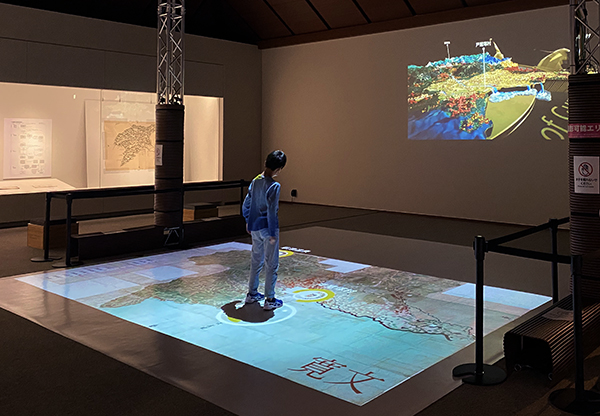
Museums can implement a similar strategy, although on a smaller time scale (fifteen to thirty minutes) and modified to the exhibit’s content. And they do not need to comply with a Game of Thrones theme. Plenty of other games such as chess, Catan, battleship, Candyland, and several others. A map projected on the floor can allow participants to stand on the projected map and move around, act like map markers themselves, or pretend to be historical figures as they interact with each other. This activity not only lets participants do history, but makes them understand the historical event/figure and context deeper and retain the knowledge for longer.
Data visualizations can be presented in several different ways such as interactive simulators, scatter plots, bubble charts, line charts, interactive graphics, and several more. Incorporating technology in history breaks the traditional history mold (pen, paper, in-person archives, etc.), just like many New York Times articles use well-made data visualizers to “usurp the traditional article format”. Some of their visualizers, such as one that ranks Game of Thrones characters or one that compares every single school district in the United States based on test scores and the socio-economic status of parents. These detailed and informative visualizations keep the readers engaged enough for them “to keep on subscribing year after year”.
Many museums keep up with the times and invest in digital displays and showcase them on individual tablets or large screens. With a screen, internet connection, and a graphic design program, it becomes easy to design data visualizers for history. Data visualizers, text information, and photos can be on the screen, and multiple screens in an exhibit allow participants to either explore in groups or individually at their own pace. It lets participants read over small details and make their own connections and conclusions from the info themselves.
Social media, like technology and the internet, constantly evolves but always engages young audiences. Most importantly with social media, it’s a platform they most likely have an account with, know how to use, and are willing to learn how to use it in different ways. Alyssa Maldonado-Estrada a professor at Kalamazoo College centered her class around Instagram, posting course content on there and her students posted pictures of videos they believed related to course readings. The students found the Instagram model of teaching and learning fun, easy, and enjoyable. The professor shared similar sentiments; “For me, reading their posts was as simple as scrolling my feed, something I would do naturally”.
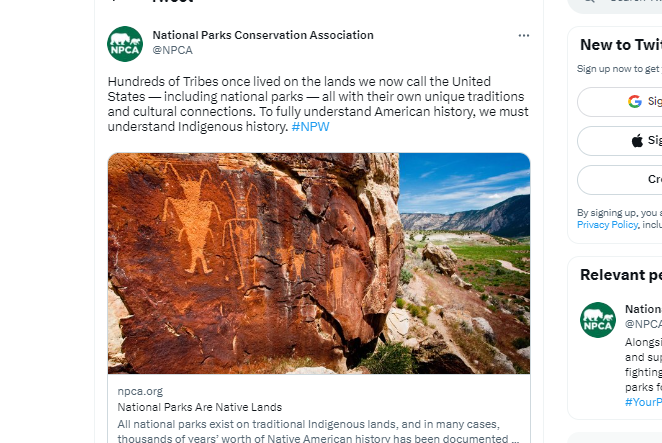
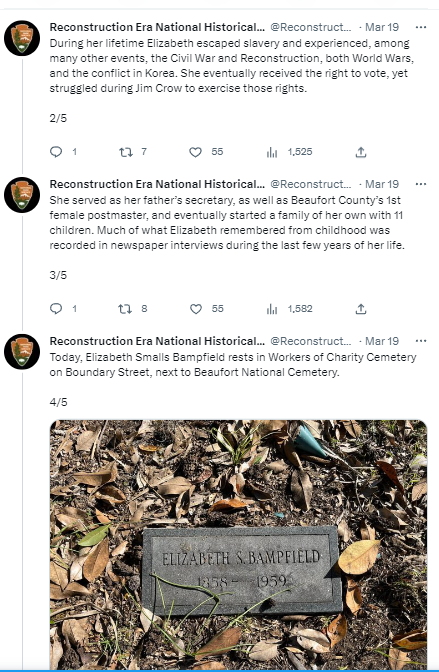
Not only is social media automatically an ingrained part of life for some people, but it’s one of the few ways they receive news and other current information. Museums and public sites can use this to their advantage. Having a social media presence not only can attract visitors, but also help spread information and even raise awareness for certain issues, similar to how the National Parks Conservation Association uses environmental and human issues to tell the history of National Parks and American history. Encouraging participants and visitors of public history sites to make their own social media posts, either tagging the site or on the social media account, can further their understanding of history, keep them engaged with the discussion, and even draw their friends and families into the discussion. Social media requires short posts though, if participants don’t want to read long threads, so creators have to be selective on the graphics and information they chose, which can make it more appealing and informative than long paragraphs.

With technology and digital tools easily accessible, the possibilities are endless. It only takes a creative mind to change how history is presented at museums and public history sites. Interactive maps allows the possibility of playing games alongside presenting information. Data visualizations make hidden connections and showcase small details for participants to explore. Practically everyone has social media, making it an easy platform to connect to others and share information in appealing ways. Now more than ever before, it’s important and easy to incorporate different forms of active learning and teaching to truly showcase history.
Lauren. “The 34 Best Interactive Data Visualizations from the New York Times.” Get Dolphins, February 27, 2018. https://getdolphins.com/blog/interactive-data-visualizations-new-york-times/.
Maldonado-Estrada, Alyssa. “Distance Learning on Insta: Using Instagram Posts & Stories to Co-Create and Share Student Ideas.” Teaching Commons. Kalamazoo College, August 25, 2020. https://teachingcommons.kzoo.edu/2020/08/25/distance-learnign-on-insta-using-instagram-posts-stories-to-co-create-and-share-student-ideas-alyssa-maldonado-estrada/.
Spalding, Sarah M., “Game of Thrones and Gaming the History Classroom.” Society of History Education, (May 2021): pages 569-590 https://www.societyforhistoryeducation.org/pdfs/M21_Spalding.pdf
Belle & Wissell, Co. “The Causes of Conflict, Interactive Visitor Experience” (Video)
https://bwco.info/work/whywar/
Toei Zukun Laboratory (photo)